

U.S. MARKETS:
Stocks recovered from an initial move to the downside but gave back ground in the latter part of the trading session on Monday. The major averages eventually ended the day mixed, with the Dow and the S&P 500 falling to their lowest closing levels in over four months.
While the tech-heavy Nasdaq rose 34.52 points or 0.3 percent to 13,018.33, bouncing off a nearly five-month intraday low, the S&P 500 dipped 7.12 points or 0.2 percent to 4,217.04 and the Dow fell 190.87 points or 0.6 percent to 32,936.41.
Stocks initially came under pressure as treasury yields rebounded amid ongoing concerns about the outlook for interest rates.
Following the pullback seen last Friday, the yield on the benchmark ten-year note moved back to the upside, briefly peeking above the key 5 percent level.
The subsequent recovery on Wall Street came as treasury yields turned lower as the day progressed, with the ten-year yield falling into negative territory.
Treasury yields turned lower after Pershing Square’s Bill Ackman said in a post on X, formerly known as Twitter, the hedge fund management company has “covered our bond short.”
“There is too much risk in the world to remain short bonds at current long-term rates,” Ackman added. “The economy is slowing faster than recent data suggests.”
Overall trading activity remained somewhat subdued, however, with a lack of major U.S. economic data likely keeping some traders on the sidelines.
On Friday, the Commerce Department is due to release its report on personal income and spending, which includes readings on inflation said to be preferred by the Federal Reserve.
Traders are also likely to keep an eye on reports on new home sales, durable goods orders, pending home sales and initial jobless claims in the coming days.
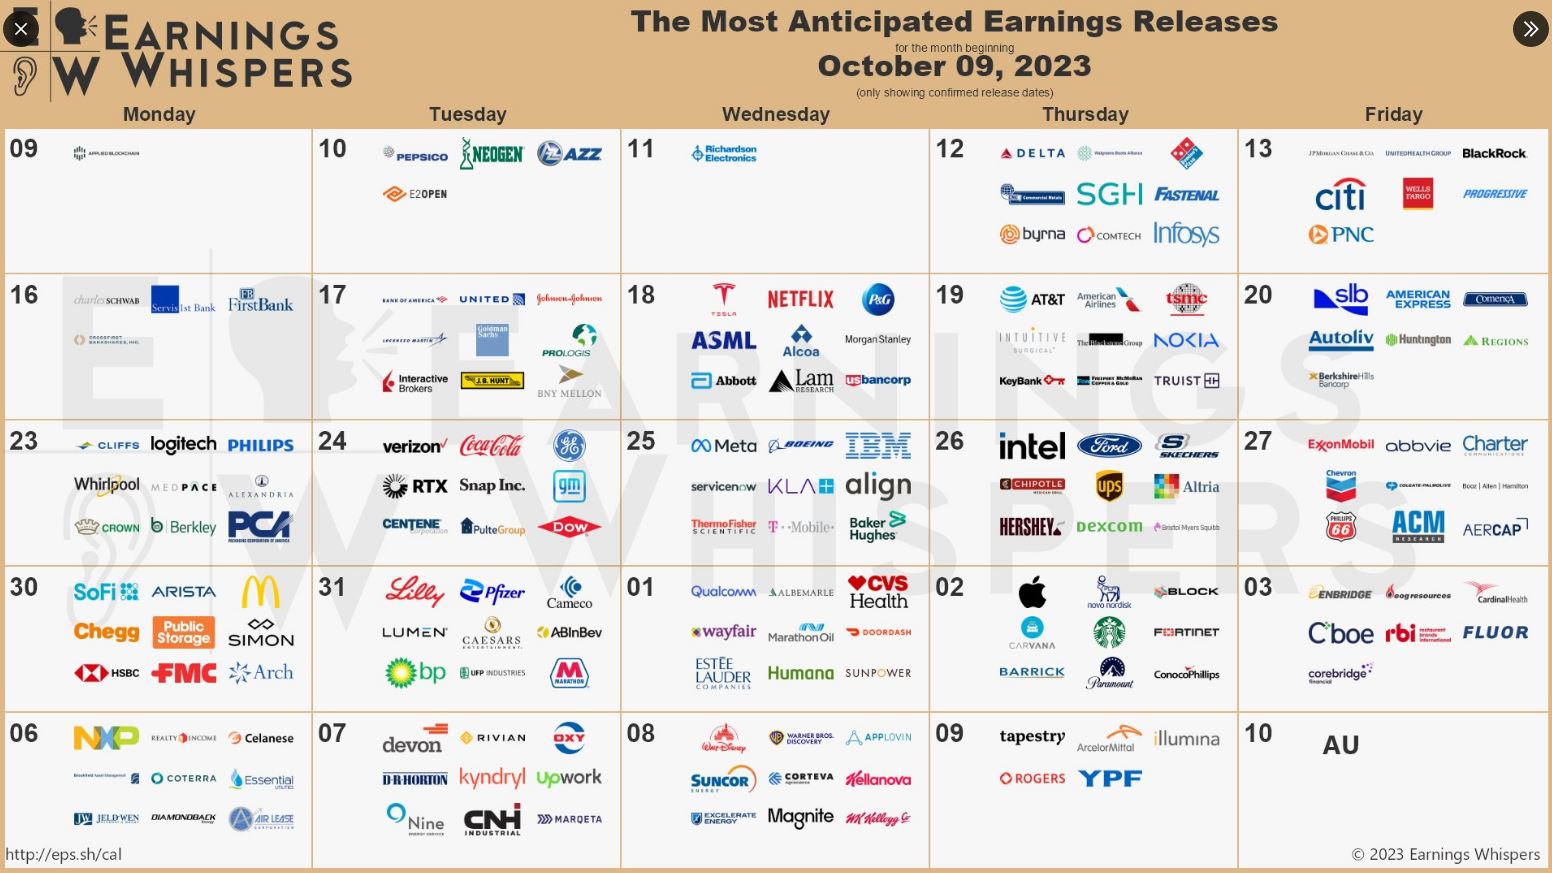
The earnings season also continues to pick up steam this week, with a slew of big-name companies due to report their quarterly results.
A steep drop by shares of Chevron (CVX) weighed on the Dow, with the energy giant tumbling by 3.7 percent after announcing an agreement to acquire smaller rival Hess (HES) in an all-stock transaction valued at $53 billion.
Semiconductor giant Intel (INTC) also came under pressure after a report from Reuters said Nvidia (NVDA) has quietly begun designing central processing units that would run Microsoft’s (MSFT) Windows operating system and use technology from Arm Holdings (ARM)
Tobacco stocks showed a substantial move to the downside on the day, dragging the NYSE Arca Tobacco Index down by 1.7 percent to its lowest closing level in a year.
Considerable weakness was also visible among transportation stocks, as reflected by the 1.5 percent drop by the Dow Jones Transportation Average.
Oil, networking and biotechnology stocks also saw significant weakness, while some strength was visible among airline stocks.
Other Markets
In overseas trading, stock markets across the Asia-Pacific region moved mostly lower during trading on Monday. Japan’s Nikkei 225 Index slid by 0.8 percent, while China’s Shanghai Composite Index slumped by 1.5 percent.
Meanwhile, the major European markets turned in a mixed performance on the day. While the U.K.’s FTSE 100 Index fell by 0.4 percent, the German DAX Index closed just above the unchanged line and the French CAC 40 Index climbed by 0.5 percent.
In the bond, treasuries showed a significant turnaround after coming under pressure in early trading. As a result, the yield on the benchmark ten-year note, which moves opposite of its price, slid 8.6 basis points to 4.838 percent.
Looking Ahead
Amid another quiet day on the U.S. economic front, trading on Tuesday may be impacted by reaction to the latest earnings news.
3M (MMM), Coca-Cola (KO), Dow (DOW), General Electric (GE), General Motors (GM), Halliburton (HAL), Spotify (SPOT) and Verizon (VZ) are among the companies due to report their quarterly results before the start of trading.
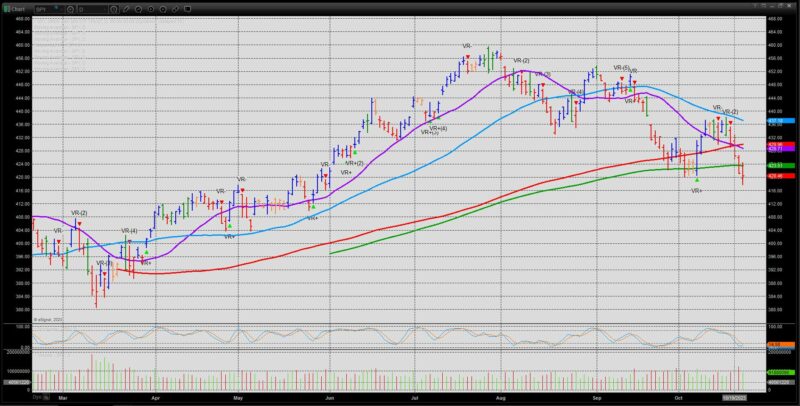
SPY – SPX ETF – DAILY. TRADING UNDER ALL KEY MOVING AVERAGES.
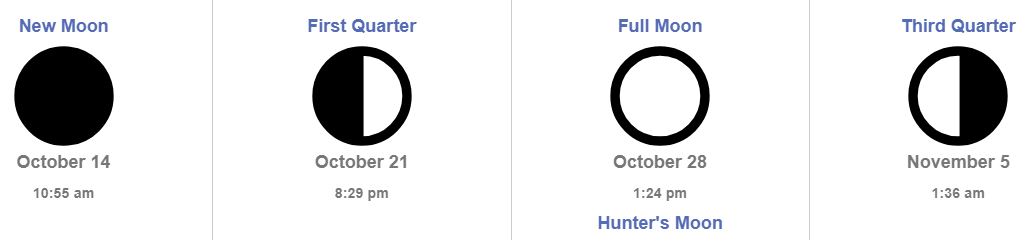
Most wars start on New Moons. Full Moon ahead!
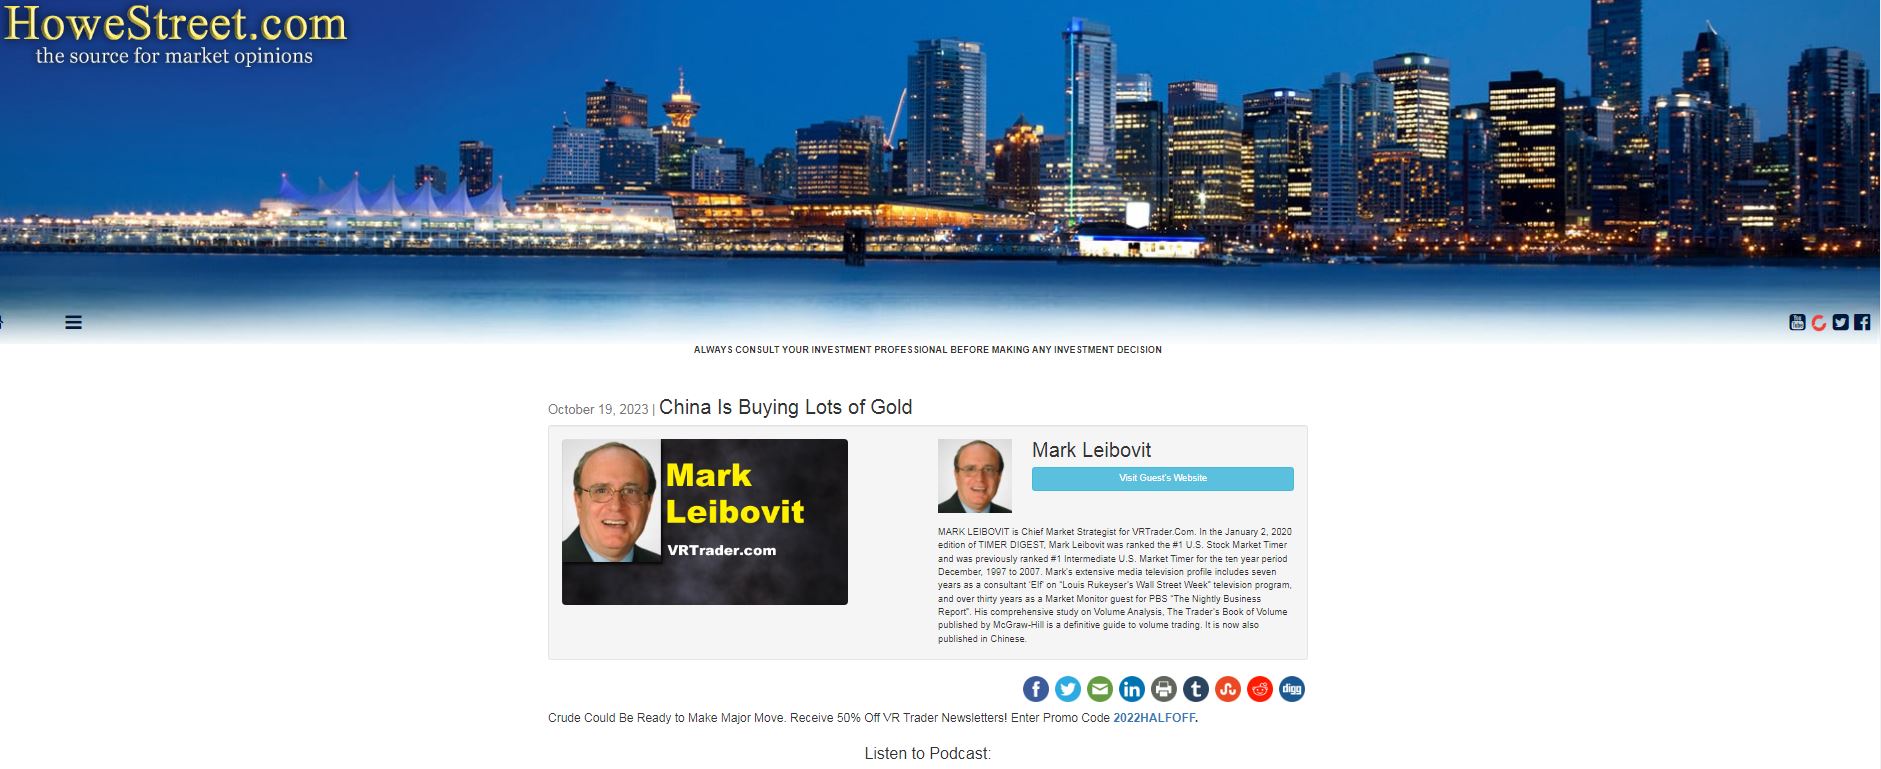
HEADLINE: CHINA IS BUYING GOLD
https://tinyurl.com/yjx33j4e
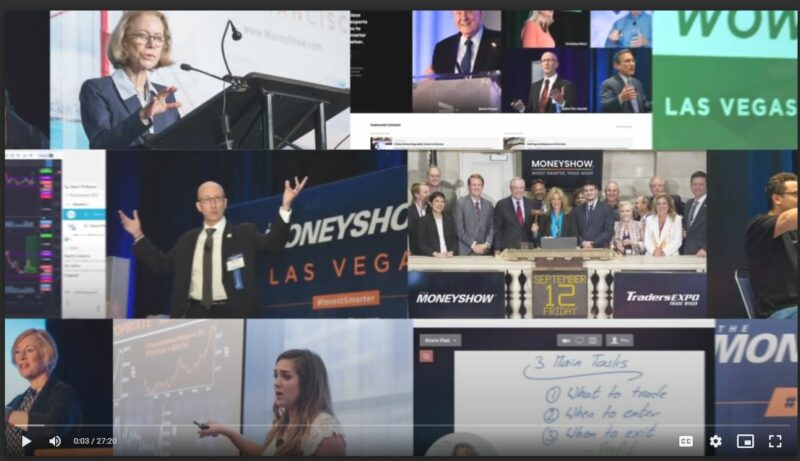
Mark Leibovit’s Market Forecast for the Major Markets

https://tinyurl.com/5acyxmup

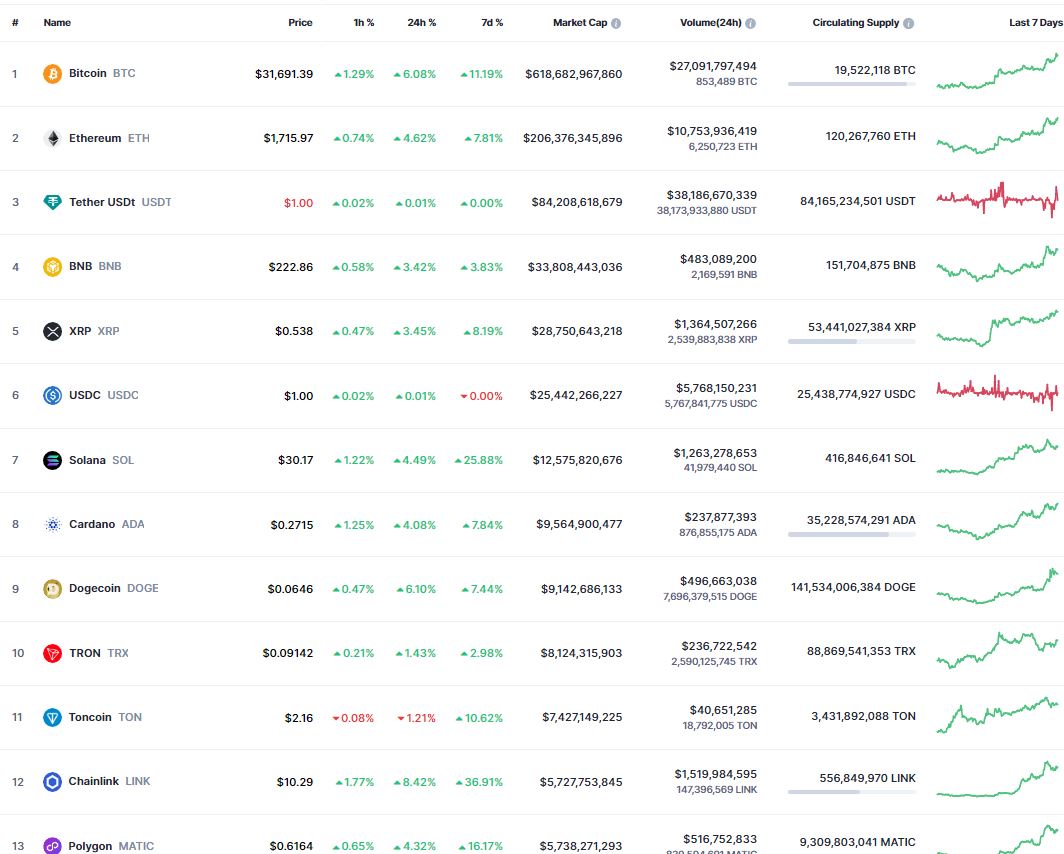
CRYPTO UPDATE AS OF OCTOBER 23, 2023:


Buy bonds & gold, be underweight equities: JPMorgan strategist -Yahoo! Finance

JPMorgan’s Chief Global Markets Strategist Marco Kolanovic is all in on Safe Haven Investments as tensions in the Middle East heat up. Now, in a note to clients, Kolanovic reiterated that he is underweight equities and recommended buying bonds and gold, saying, quote, “While it remains uncertain whether bonds have bottomed, we add back 1% to our government bond allocation given geopolitical risk, cheap valuations, and less pronounced positioning.”
So not necessarily anything new that we’re hearing from Marco Kolanovic. But again, just a warning here to the Street just in terms of what exactly the next couple of months could look like when we talk about the pressure that we could potentially see on equities. We’ve seen many strategists here rein in some of their year end price targets for the S&P, what that looks like going into 2024 and how this all plays out. Obviously, a huge issue for investors. And we’re seeing that reflected from some of these analyst calls on the Street.
Silver Market Update – TINY DOWNSIDE, HUGE UPSIDE… – Clive P. Maund

At this point, given what is going on in the world, silver is regarded as probably the best value investment around with very little downside and huge upside. It is still significantly undervalued relative to gold, which reflects the recent negative sentiment towards the Precious Metals sector that is characteristic of a bottom.
The recent weakness across the sector has been due to a combination of a relatively strong dollar – it has been strong relative to other currencies but intrinsically weak – and rising interest rates. However, the rise in interest rates has been due to the gathering meltdown in the debt market which the Fed and other Central Banks are trying to stave off by means of creating trillions of extra dollars or other currencies, a course of action that will lead to hyperinflation that will in turn trigger a torrent of funds seeking safe haven to flood into the Precious Metals whose finite supply will result in a sector bull market of unprecedented proportions.
The S&P 500 is in a historic bubble and could crash by 63%, markets guru John Hussman warns -Business Insider
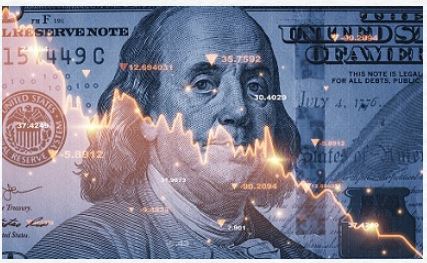
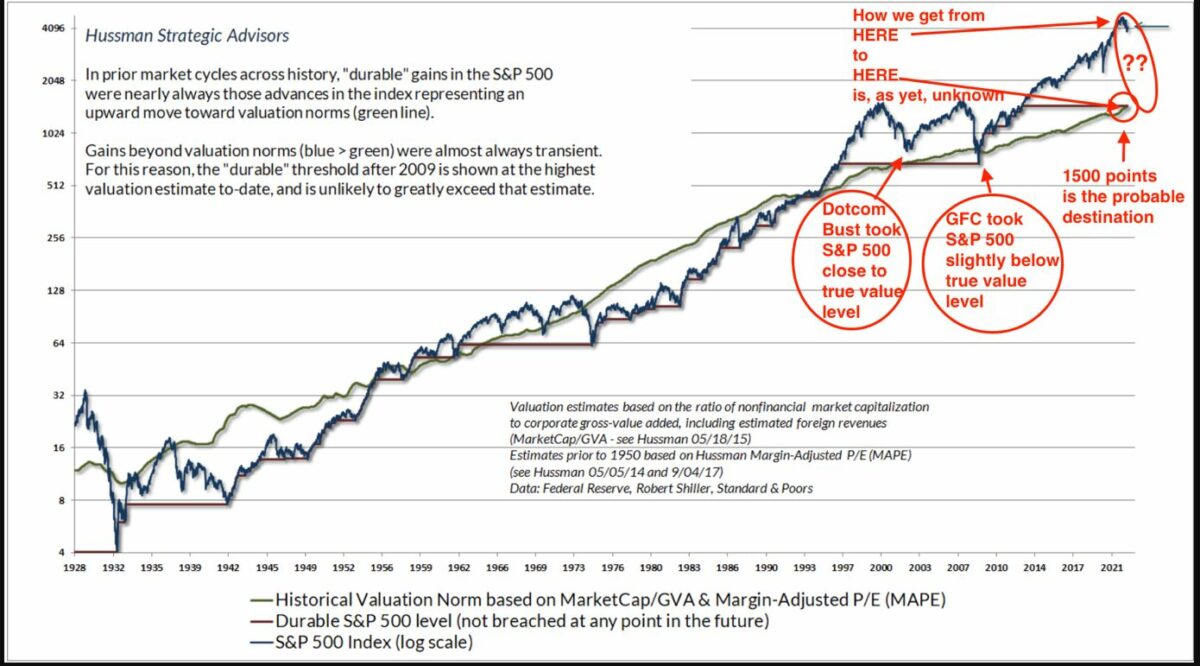
The S&P 500 is poised to drop 63%; this according to market guru John Hussman. Overvalued markets, coupled with a cracking economy, make this no surprise to many; however, it seems many investors think the party can keep raging. This “reckless speculation” may ultimately be their undoing.
by Theron Mohamed
franklin”Market valuations stand at one of the three great bubble extremes in US history,” rivaling the peaks of 1929 and 2000, the veteran investor and financial historian said in his latest research note. Those two previous periods of reckless speculation ended disastrously, and the current bubble is likely to unwind in similar fashion, he added.
The Hussman Investment Trust president based his bleak outlook on an analysis of stock-market returns over the last century or so. He cautioned that virtually every market cycle in history has ended with projected S&P 500 total returns returning to historical norms.
“At present, that would require a market loss on the order of -63% in the S&P 500,” he wrote, raising the prospect that the benchmark stock index could fall to around 1,600 points, its lowest level since 2013.
“That’s not a forecast, but it certainly is a historically-consistent estimate of the potential downside risk created by more than a decade of Fed-induced yield-seeking speculation,” he continued. “Buckle up.”
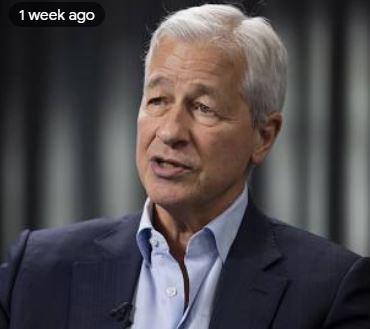
The war in Ukraine, along with the unprecedented attacks in Israel by Palestinian militant group Hamas last weekend, may have “far-reaching impacts on energy and food markets, global trade and geopolitical relationships,” Dimon said in a statement accompanying the bank’s third-quarter earnings release. “Thismay be the most dangerous time the world has seen in decades,” Jamie Dimon said. – Megan Henney, “JPMorgan CEO Jamie Dimon warns: ‘This May be the Most Dangerous Time the World has seen in Decades’: Sounds Alarm over Economic Outlook Amid Israel-Hamas War,” www.foxbusiness.com,
October 13, 2023.
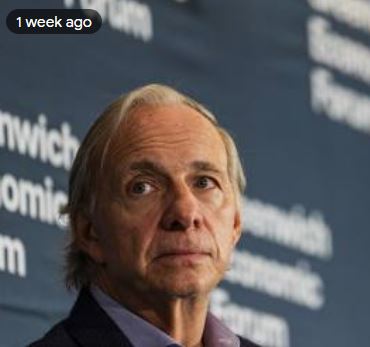
Billionaire investor Ray Dalio said there’s a 50-50 chance a world war will break out in light of the Israel-Hamas conflict.
“In my opinion, this war has a high risk of leading to several other conflicts of different types in a number of places, and it is likely to have harmful effects that will extend beyond those in Israel and Gaza,” Dalio wrote in an essay titled “Another Step Toward International War,” which he posted Thursday on LinkedIn.
“Primarily for those reasons, it appears to me that the odds of transitioning from the contained conflicts to a more uncontained hot world war that includes the major powers have risen from 35% to about 50% over the last two years.”
https://tinyurl.com/3mfhf7zf
This Chart Should Have You Quaking with Fear -Daily Reckoning
Everyone is familiar with the expression, “a picture is worth a thousand words”; the graph here depicts the bubbles we have waiting to pop in our markets today and can be summed up in one word … terrifying. This particular graph has been utilized since 1928 and has been one of the more consistent foretellers of market movement.
by Vern Gowdie
We have no control or influence over what the Fed or any central bank may or may not do.
We cannot control the level of incompetence exercised by elected officials.
The only thing we have power over are our own thoughts and actions.
Knowledge is the key to successfully navigating, what I anticipate, is going to be a very challenging period ahead.
What we think we know (based on a multitude of long-established valuation metrics) is the US share market peaked in late 2021, at what can be best described as…an extremely over-valued level.
Historically, over-valued and under-valued markets go through a time-honoured process of ‘mean reversion’…falling to lower levels or rising to higher levels.
John Hussman’s ‘Durable Gains’ chart – tracking the emotional ebb and flow of the S&P 500 (blue line) against the mathematically determined ‘True Value’ (green line) since 1928 – illustrates how, over the longer term, the S&P 500 ‘ducks and weaves’ its way around the level of ‘true value’.
When social mood is less than upbeat – Depression, The Second World War and the Inflationary 1970’s – the S&P 500 falls below its True Value…a signal to buy…one most people ignore.
Conversely, if people’s spirits are buoyed by a feeling of prosperity (the 1950s and 60s and 1995 onwards), the S&P 500 is pushed higher by a feel-good air of optimism…a signal to reduce exposure…again, one most people ignore.
Global central banks are hoarding gold like never before as they seek to reduce ‘overconcentration’ of dollar reserves -Business Insider

by Anil Varma
USAGlobal central banks have been snapping up record amounts of gold since the start of 2022 – a trend that should continue as countries look to move away from an “overconcentration” of reserves in the dollar, according to State Street Global Advisors.
Monetary authorities across nations made net purchases of 387 metric tons of the yellow metal in the first half of 2023, after buying an unprecedented 1,083 tons the whole of last year, the world’s fourth-largest asset manager said in a recent note.
In addition to reserve diversification, the trend is also driven by central banks’ desire to strengthen balance sheets and increase liquidity without adding credit risk, according to the firm.
“The reasons driving central bank gold purchases – to diversify their reserves, improve their balance sheets, and gain liquidity from an asset without credit risk – likely won’t change given today’s increasing economic and geopolitical risks,” Maxwell Gold, head of gold strategy at State Street, wrote in the note.
“Therefore, as we look ahead, we expect central banks to continue their role as net purchasers of gold,” he added.
What happens if the government shuts down: An illustrated guide-CNN
With Congress barreling toward a government shutdown, many Americans are wondering how it could affect them. Here’s a guide to what you can expect.
What is a government shutdown?
A government shutdown happens when Congress doesn’t approve funding for the federal government by the time the new fiscal year starts on October 1. Each year, Congress must pass the 12 appropriation bills that make up the discretionary spending budget and set funding levels for federal agencies.
What happens during a government shutdown?
If lawmakers fail to enact all or some of the appropriation bills, many government operations grind to a halt, resulting in a full or partial government shutdown until Congress acts. However, government functions that are deemed essential will continue.
Each federal agency comes up with a contingency plan that outlines which of its functions will continue during a shutdown and which will stop, as well as how many of its employees will continue working and how many will be furloughed until the shutdown ends.
What it means for you
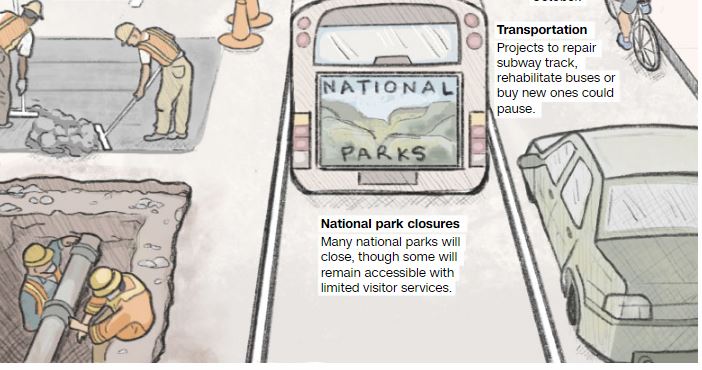
Because many federal workers are off the job during a government shutdown, many services are stopped or slowed, disturbing the day-to-day life for many Americans.
Notably, Social Security payments to seniors, Americans with disabilities and others would continue to be distributed. The Postal Service will also continue regular service.
Here are some examples of how a shutdown could affect you.

The SEC is Snooping on All Your Trades
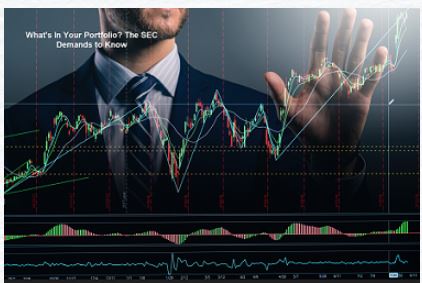
EDITOR’S NOTE: The War on Cash is fought on a variety of fronts but the end result is always a loss of liberty and privacy for us all. The SEC’s sharing of the data on every market move we make is just the latest strategy. While the tracking should be alarming in and of itself, the threat of this information being open to hacking is of even greater concern. A centralized database to track every American investor is, without question, an unconstitutional data grab; but can it be stopped?
What’s in Your Portfolio? The SEC is Snooping on All Your Trades -MishTalk.com
portfolioThe SEC is now tracking your stock trades by your Social Security Number. It shares the data with 3,000 outside agencies.
In 2012 the SEC approved a new rule requiring a Consolidated Audit Trail to Monitor and Analyze Trading Activity.
“A consolidated audit trail that accurately tracks orders throughout their lifecycle and identifies the broker-dealers handling them will provide us with an unprecedented ability to effectively oversee the markets we regulate,” said SEC Chairman Mary Schapiro.
The new rule becomes effective 60 days after its publication in the Federal Register. SROs are required to submit the NMS plan to the Commission within 270 days of the rule’s publication in the Federal Register. Once the Commission approves the NMS plan, the SROs are required to report the required data to the central repository within one year, and members of the SROs are required to report within two years. Certain small broker-dealers will have up to three years to report the data.
This ruling was in response to a 2010 flash crash and quietly sat for years. The SEC is now following through.
The scope of the Consolidated Audit Trail, or CAT, a regulation the SEC issued in 2016 but implemented only recently, is breathtaking and unprecedented. In the words of the SEC press release, the regulation instructs regulated financial institutions to identify “every order, cancellation, modification and trade execution for all exchange-listed equities and options across all U.S. markets.”
What about the January Barometer?

The January Barometer calls for a positive year-end outcome, but a lot can happen between now and then. Please check with previous editions discussing the calculation of the Barometer.


https://tinyurl.com/2rd9wv52
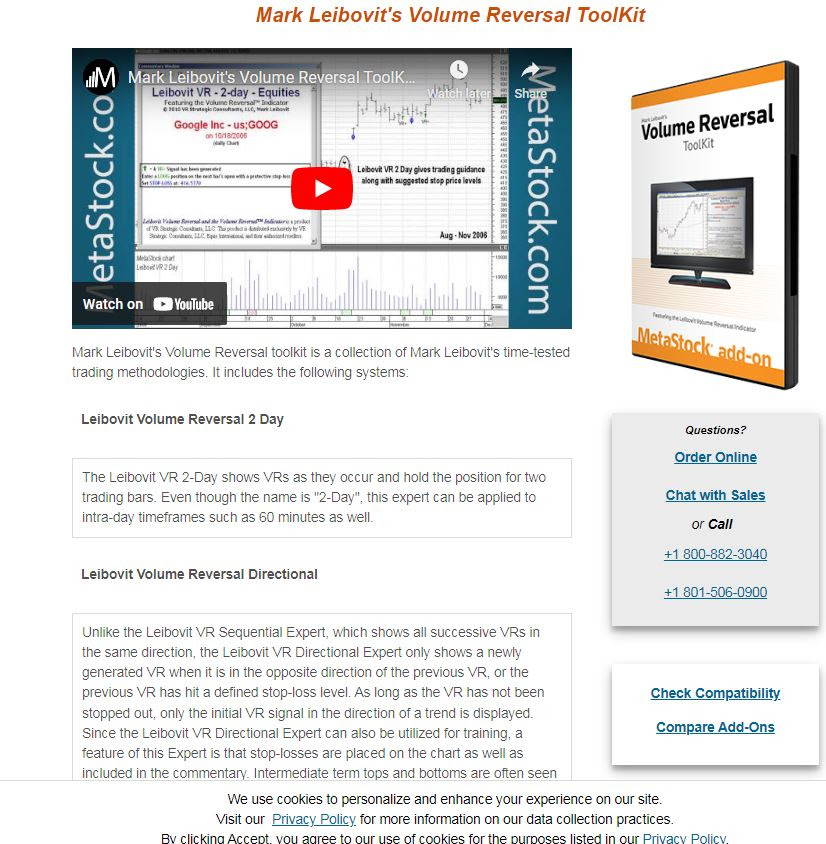
OPPORTUNITY TO ACCESS MARK LEIBOVIT’S PROPRIETARY VOLUME REVERSAL INDICATOR – THIS IS THE ONLY PLACE TO DO IT!
https://www.metastock.com/
COME ON, DAD. IT’S TIME TO EAT

DISCLAIMER:
WE ARE NOT FINANCIAL ADVISORS AND DO NOT PROVIDE FINANCIAL ADVICE
The website, LeibovitVRNewsletters.com, is published by LeibovitVRNewsletters LLC.
In using LeibovitVRnewsletters.com (a/k/a LeibovitVRNewsletters LLC) you agree to these Terms & Conditions governing the use of the service. These Terms & Conditions are subject to change without notice. We are publishers and are not registered as a broker-dealer or investment adviser either with the U.S. Securities and Exchange Commission or with any state securities authority.
All stocks and ETFs discussed are HYPOTHETICAL and not actual trades whose actual execution may differ markedly from prices posted on the website and in emails. This may be due internet connectivity, quote delays, data entry errors and other market conditions. Hypothetical or simulated performance results have certain inherent limitations as to liquidity and execution among other variables. PAST RESULTS ARE NOT NECESSARILY INDICATIVE OF FUTURE FORECASTING ACCURACY OR PROFITABLE TRADING RESULTS.
All investments are subject to risk, which should be considered on an individual basis before making any investment decision. We are not responsible for errors and omissions. These publications are intended solely for information and educational purposes only and the content within is not to be construed, under any circumstances, as an offer to buy or to sell or a solicitation to buy or sell or trade in any commodities or securities named within.
All commentary is provided for educational purposes only. This material is based upon information we consider reliable. However, accuracy is not guaranteed. Subscribers should always do their own investigation before investing in any security. Furthermore, you cannot be assured that your will profit or that any losses can or will be limited. It is important to know that no guarantee of any kind is implied nor possible where projections of future conditions in the markets are attempted.
Stocks and ETFs may be held by principals of LeibovitVRNewsletters LLC whose personal investment decisions including entry and exit points may differ from guidelines posted.
LeibovitVRNewsletters.com cannot and do not assess, verify or guarantee the suitability or profitability of any particular investment. You bear responsibility for your own investment research and decisions and should seek the advice of a qualified securities professional before making any investment. As an express condition of using this service and anytime after ending the service, you agree not to hold LeibovitVRNewsletters.com or any employees liable for trading losses, lost profits or other damages resulting from your use of information on the Site in any form (Web-based, email-based, or downloadable software), and you agree to indemnify and hold LeibovitVRNewsletters.com and its employees harmless from and against any and all claims, losses, liabilities, costs, and expenses (including but not limited to attorneys’ fees) arising from your violation of this agreement. This paragraph is not intended to limit rights available to you or to us that may be available under the federal securities laws.
For rights, permissions, subscription and customer service, contact the publisher at mark.vrtrader@gmail.com or call at 928-282-1275 or mail to 10632 N. Scottsdale Road B-426, Scottsdale, AZ 85254.
The Leibovit Volume Reversal, Volume Reversal and Leibovit VR are registered trademarks.
© Copyright 2023. All rights reserved.

