
Annual Forecast Models – 2026

February 28, 2026:
I start my Annual Forecast Model report the same away each year, so need to change after thirty-three. A picture is worth a thousand words, so I will try and keep my commentary brief. But, first, some background for new subscribers.
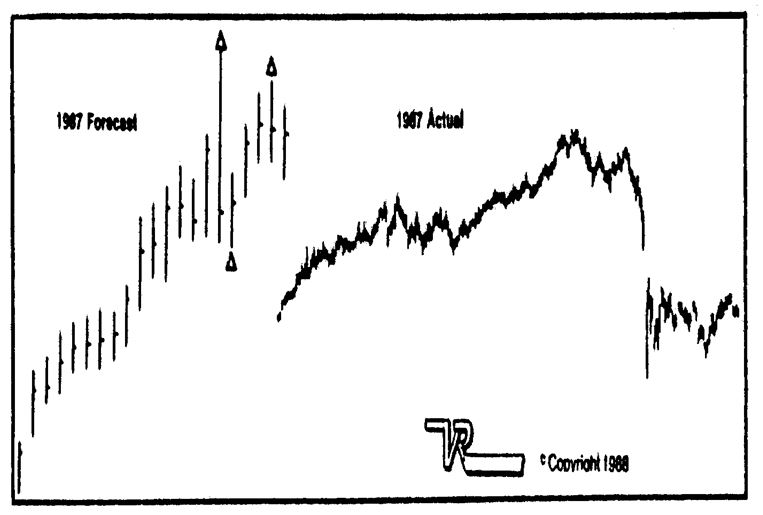
Thank you once again for subscribing to The VR Forecaster (Annual Forecast Model) – published annually since 1987. It is, in fact, the success of 1987 Model that set the stage for all future reports. The rudimentary chart of the 1987 Model (below) which was published in January 1987 warned of some significant volatility for the October ahead, and in my January commentary I stated:
“What does 1987 hold in store? Well, if a picture is worth a thousand words, this one should be clear: We’re going up! But watch out for that nasty step scheduled around early October.”
Well, we all know that ‘nasty step’ was the 1987 Crash and the rest is history. The financial press provided me with some recognition at that time. I recall while on the Wall Street with Louis Rukeyser program in September 1987 stating that something was coming by the third week of October, though I was cautiously bullish up until that time. Of course, early October saw a sharp reversal to the downside with a one-day 90 point decline which was huge for 1987. That changed everything, and the Annual Forecast Model was very much in sync.
1987 Chart
For years, the various ‘Bellwether’ rules and axioms for predicting the future course of the stock market have been freely bandied about and in most stances were regarded as nothing more than curiosities without any real or practical application. Students of these bellwether indicators, however, take them more seriously and usually have statistics backing them up when presenting their conclusions. Examples of such bellwether applications include the Super Bowl Indicator, the General Motors Bellwether Theory, the Hemline Indicator and, the Swimsuit Indicator, the Presidential Election Cycle, Groundhog Day, the Halloween Indicator, the Thanksgiving ‘turkey shoot’, the Santa Claus rally, and, of course, the January Barometer.
As in the 2019 edition, I have cut back and will be ONLY portraying the Annual Forecast Models. Please refer to the 2017 and prior years issues for a discussion of the aforementioned ‘bellwether’ indicators.
MARK LEIBOVIT – THE ANNUAL FORECAST MODELS
You have in your hands one of the most unique market investment/trading tools in existence. Since you’ve already paid for it, you know that this is not sales hype, it is fact! While no indicator is perfect, its uncanny record in calling significant turning points and overall trend for the stock market is, in my experience, unparalleled, particularly since it is published early in the year and looks out nearly 12 months in advance.
This year the Annual Forecast Model will include the Dow Industrials, Crude Oil, Gold, Silver, Copper, Treasury Bonds, U.S. Dollar, Bitcoin, Uranium and Lithium
BACKGROUND OF THE ANNUAL FORECAST MODELS
Please keep these reports confidential. You have paid quite a bit of money to see them. The more eyes that see it, the less reliable it will ultimately become. However, even though I reserve the right to show small pieces of the AFM in the media for promotional purposes, especially historical results. It has been shown on the Nightly Business Report on PBS, the Business News Network (BNN) in Canada, at the Trader’s Expo in Las Vegas or at the World Outlook Conference in Vancouver, B.C.
The following comment may sound extraordinary, but years ago I was informed by a famous ‘anonymous’ source that My Annual Forecast Model may be a replication of either the Federal Reserve System Model or perhaps the Plunge Protection Team ‘Model’ for the market in the year ahead. He even suggested that perhaps they may even be using my ‘Model’. How about that?
Please keep in mind this is a business where analysts who developed incredible multi-year or decade track records are judged solely by their ‘last’ trade. In other words, you’re a bum if you’re last trade was a bad call to the detriment of all your previous work. New or novice investors or those only seeking to eke out short-term gains may by chance acquire access to this ‘Model’ at a moment it gets out of sync and judges it harshly. Those of you, however, who have tracked these reports for several years know differently. No one can be perfect all the time and this report provides ‘value-added’ to your own research and insight. Regardless of whether the current signals (especially the Dow Industrials below) pan out or not, I’m sticking with the AFM, as it has served me well for over twenty years and placed my name at the top of market-timers in the United States.
UNDERSTANDING THE ANNUAL FORECAST MODELS CONSTRUCTION
The dates listed along the horizontal axis are often coincident with ‘change points’ in the various markets and are still useful to traders whether the overall forecast for those markets is on track or inverted. For those of you new to the AFM’s construction and guidelines, let me lay out some ground rules. First, the AFM’s construction is fairly simple. The vertical axis denotes direction and the horizontal axis denotes time. A chart zig-zagging lower is a bear market pattern, but a chart zig-zagging higher is a bull market pattern. Secondly, please note the AFM does NOT attempt to predict amplitude, but only predicts direction! In other words, the Model’s forecast the TIME when high and low points in the stock market may occur, not what the precise high or low the market may be. Peaks and troughs can be at any level. It basically comes down to a question of relativity. Even though the chart may show a high point or a low point, there is no specific numerical value associated with that point, i.e., Dow Industrials 31,000 or 10,000. The AFM formula simply does not generate such values. In addition, new relative highs or lows in the AFM do not necessarily suggest higher market highs or lower market lows. These points could turn out to be relative highs or lows and nothing more. Thirdly, the AFM is presented in good faith as a general guide for the future. Though we make no modifications during the course of the year, we are always paying close attention to other technical, cyclical and sentiment indicators to help ‘fine tune’ what is unfolding in the marketplace. As we have all learned in the past, placing too much weight on any one indicator (including the AFM) may not be the best decision.
PAST PERFORMANCE DOES NOT GUARANTEE FUTURE RESULTS!
The AFM was originally created to provide an overall cyclical forecast for the year ahead. In this regard, it has done an excellent job over the years. Luckily over the years, the AFM has also been fortunate enough to pinpoint exact turning points during the year.
What we are looking for is the GENERAL PATTERN of the AFM in any given period. Is the pattern bullish or bearish, is the pattern rising or falling dramatically or modestly?
The discussion below refers to solely the AFM for the DJ Industrials:
The bearish pattern displayed in the 2000 AFM when it was published February 1, 2000, certainly presented clear warning of what may lay ahead. The low point predicted for the end of March 2001 dramatically presented the power of the AFM to predict an excellent near-term buying opportunity. The high point predicted for the end of March 2002 or the low point in July 2002 also turned out to be deadly accurate presaging a multi-month correction to the downside for the former and a sharp rally for the latter. The AFM for 2003 predicted a low point in March (specifically, March 26 which was ten days off – doesn’t that sound familiar? – Same thing happened in July 2002). The 2006 AFM for the Dow Industrials correctly predicted a May high and a summer low. The AFM for 2007 was outstanding except for the last couple of weeks of December. It called for a top in January/February, a mid-March low a high June/July, a mid-August low, a low the third week of October then followed by year-end rally – a year-end rally which unfortunately ran into a brick wall in mid-December. The AFM for 2008 was a clear bear market signal, even though the predicted low point was early (mid-September). Remember, that warning was flashed in January to subscribers! The 2009 AFM was bearish into the summer followed by a rally into year-end. As you know, the low came instead in March, but the overall pattern was correct of looking for a buy point by mid-year. And, the 2010 AFM foretold a rally into the summer to be followed by a sharp (nearly crash) sell-off. Instead, we saw the ‘Flash Crash’ on May 6. What about 2011? The AFM correctly called for a peak in February, a trough in April, a peak July, an August low and a year-end recovery. And, in 2012, the Dow Industrials tracked the Model’s undulations very, very closely – one of the best tracking patterns in recent years! Bottom line, it told you to remain bullish! A strong bullish pattern in the 2013 AFM also correctly portrayed a bullish outcome. Last year this time I wrote: “we could very well see the S&P at 1700 and the Dow Industrials at 16,000 this year!” The 2014 AFM correctly predicted a strong rally into late July, early August to be followed by a huge washout! This was a bullseye call, particularly since most high-flying stocks barely recovered despite the sharp rally try following the October low. The AFM correctly called for sideways to lower market in 2015, noting a late summer now followed by a lower high in the Fall then followed by a year-end sell-off. The bias was a declining trend line for the year at large. The AFM was correct only 50% of the time, i.e., in the second half of the year – but still an important market call! Just like 2016, the AFM in 2017 did better in the second half of the year calling the August low and a top (especially in Nasdaq) in late November/early December. The 2018 AFM predicted a bullish 2018 with a potential sell-off in the fourth quarter. It did not predict the sharp sell-off into February but overall created an excellent forecast. The 2019 AFM correctly outlined a steady rising pattern for the DJ Industrials throughout the year! A great forecast! The 2020 forecast made two out of three great calls – the March low and the late August top, but failed to call the year-end rally. Still, a remarkable achievement in an historic volatile and news driven year! The 2021 forecast correctly pinpointed a bullish year but was anticipating sharp corrections in the second half of the year which we saw in September and November. However, it was looking for a year-end sell-off which did not occur. The 2022 forecast was a ‘textbook’ forecast. I do not like to call anything perfect, but the forecast and the results were nearly perfect.
The 2023 DJ forecast was also a textbook forecast calling for a positive market into summer, followed by a nosedive into the fall and then followed by a year-end rally.
The 2024 DJ forecast was also a textbook forecast calling for a positive market all year with a possible pullback in the summer fall.
The 2025 DJ forecast was also pretty close to a textbook forecast calling for some weakness in the first quarter and third quarter but overall pointing to a strong and bullish year.
The following comment came from AFM subscriber Dennis which I thought you might find interesting:
AFM charts below vary from year to year. The dates along the horizontal axis could represent ‘change points’ and need to be monitored. These dates apply to all the charts for 2024:
THE YELLOW LINE IN THE CHARTS BELOW REPRESENTS ACTUAL RESULTS
THE DOW INDUSTRIALS
But, first, here are the forecasts and results from 2013 to date


DOW JONES INDUSTRIALS 2026 FORECAST
CRUDE OIL
But first, here are the forecasts and results from 2015 to date:
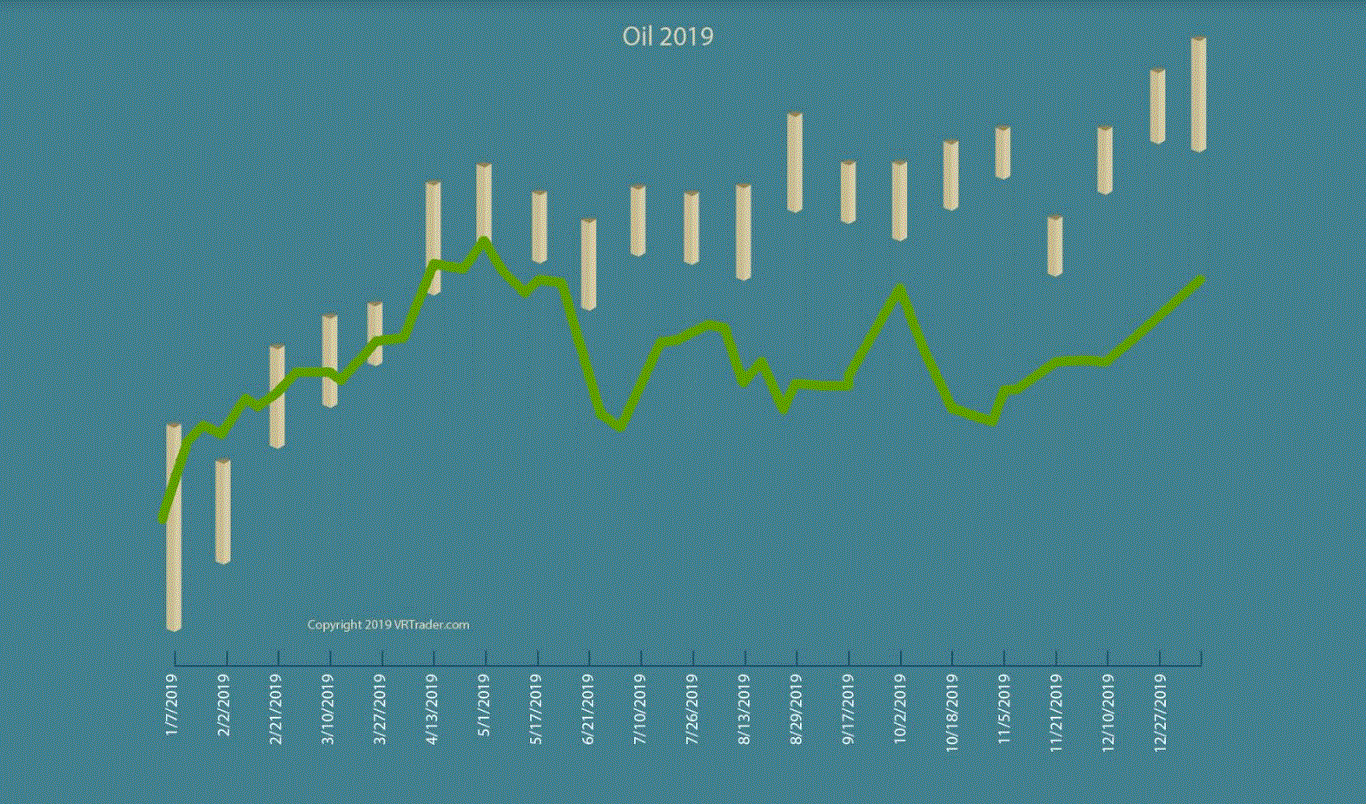
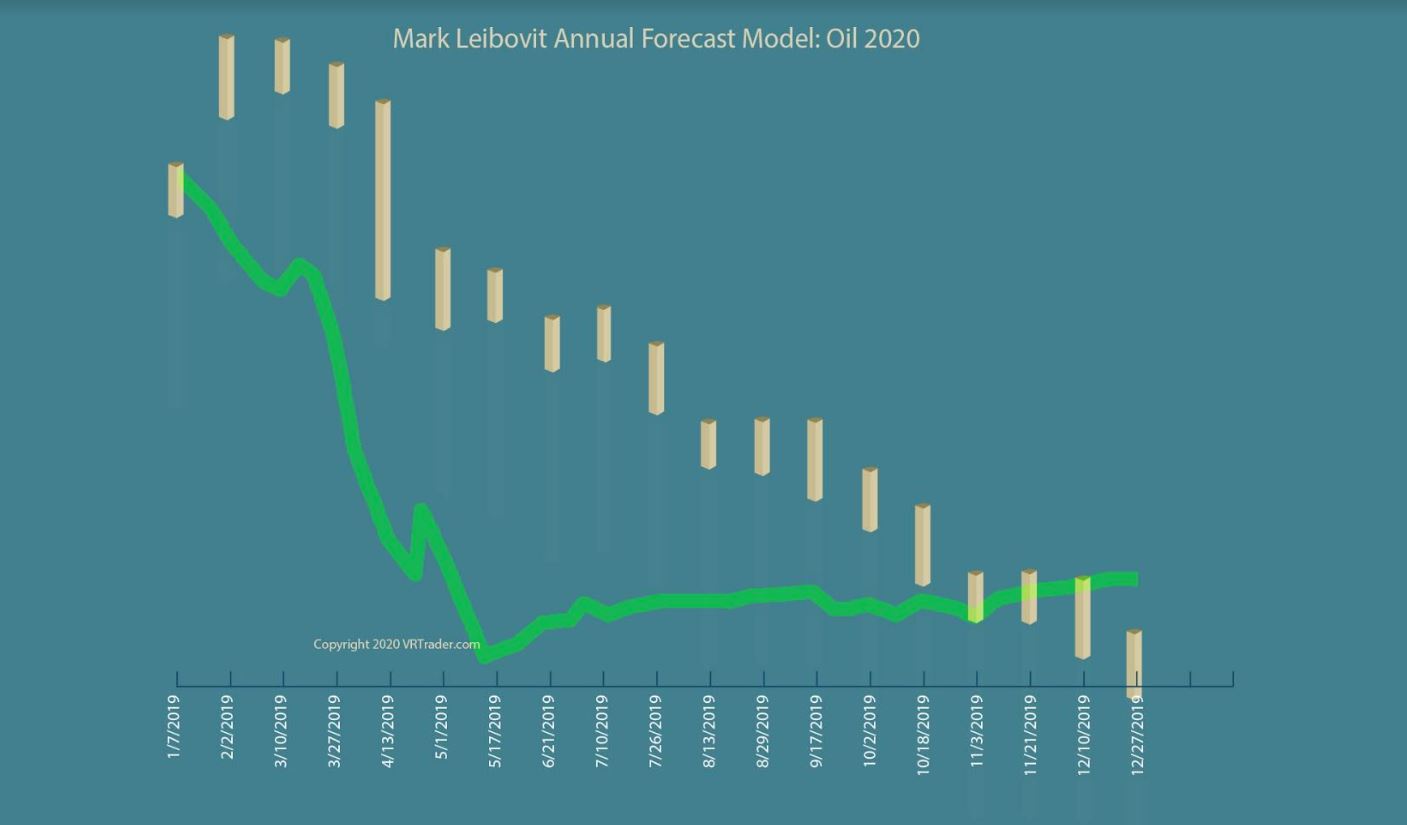
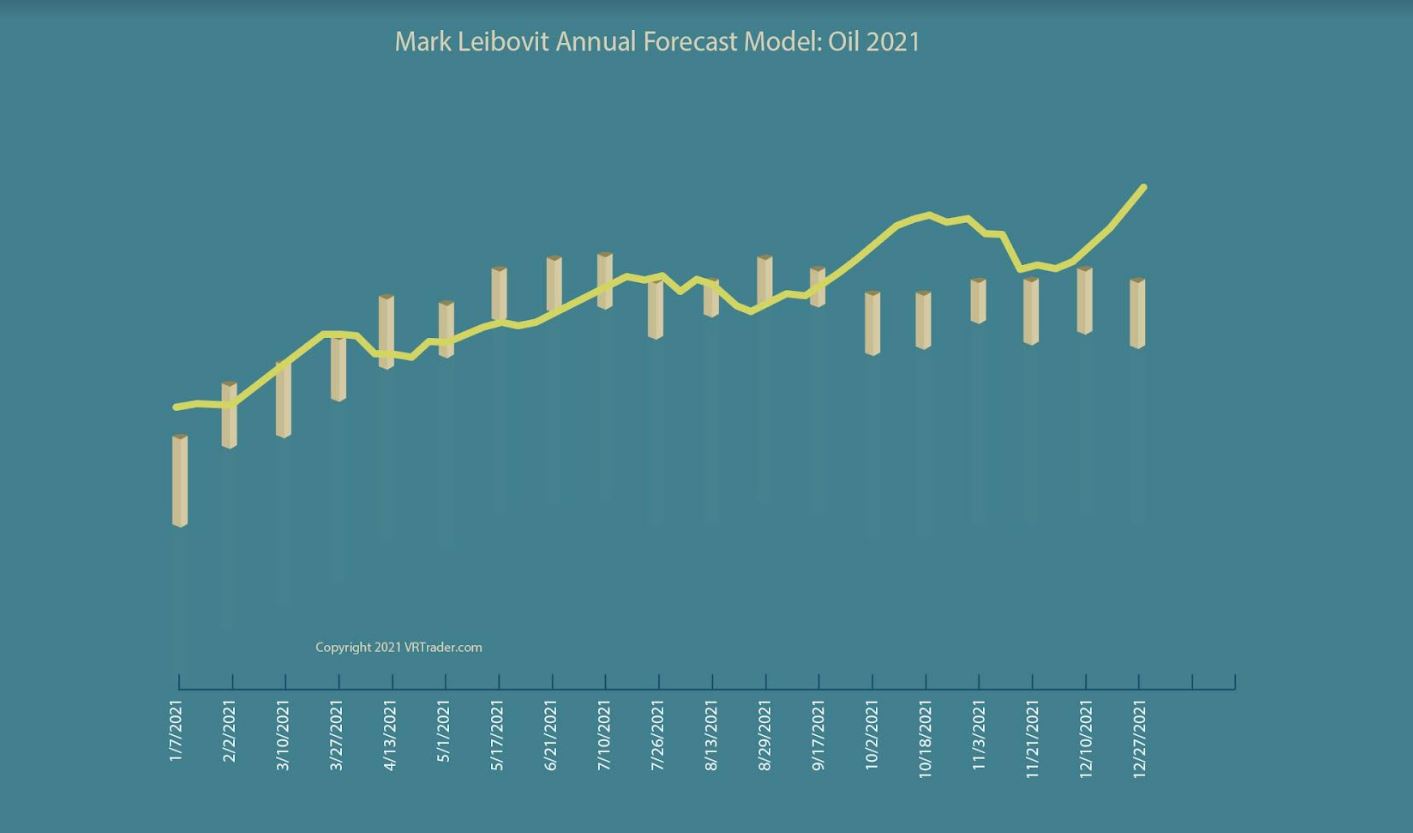
CRUDE OIL 2026 FORECAST
GOLD
But first, here are the forecasts and results since 2014:
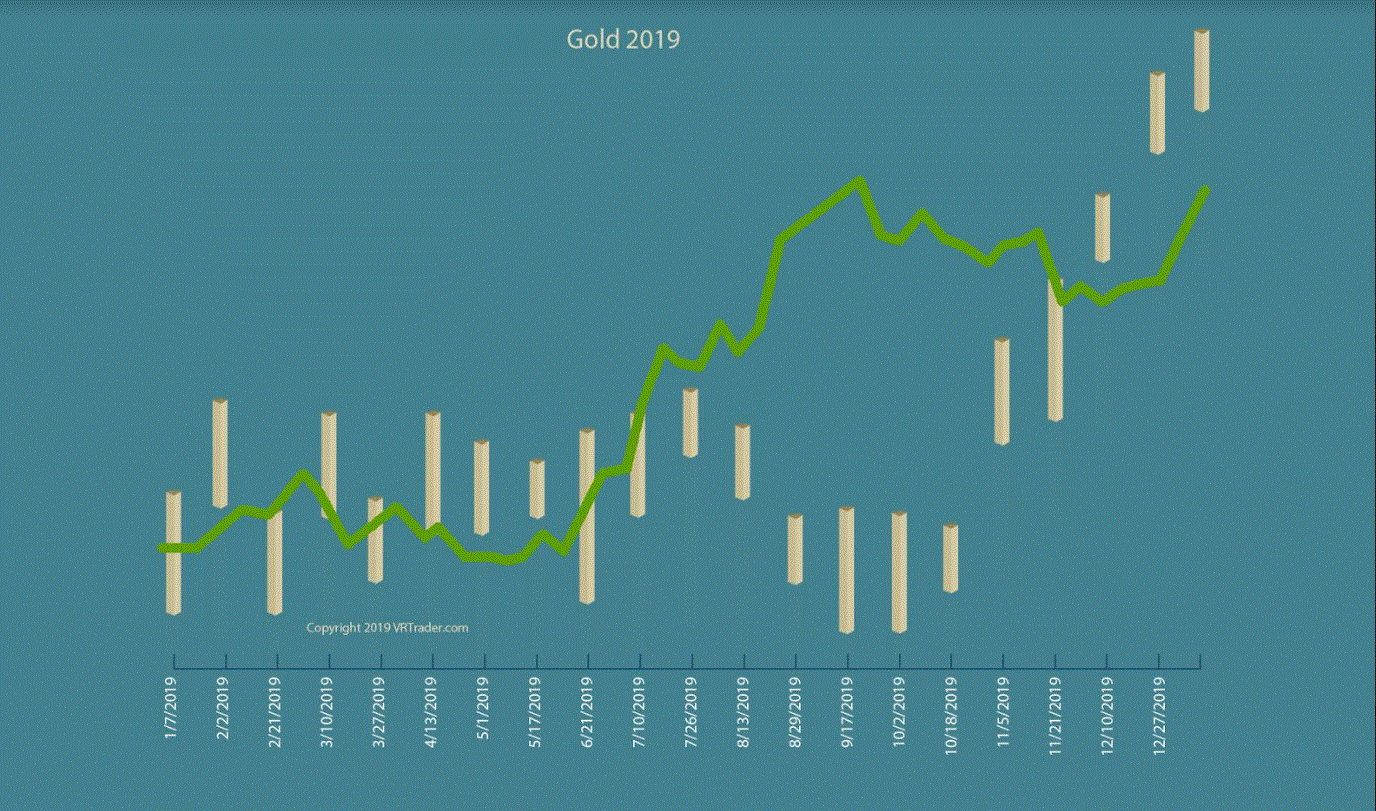
GOLD 2026 FORECAST
U.S. DOLLAR INDEX
But first, here are the forecasts and results since 2015:
THERE WAS NO DOLLAR FORECAST FOR 2019.
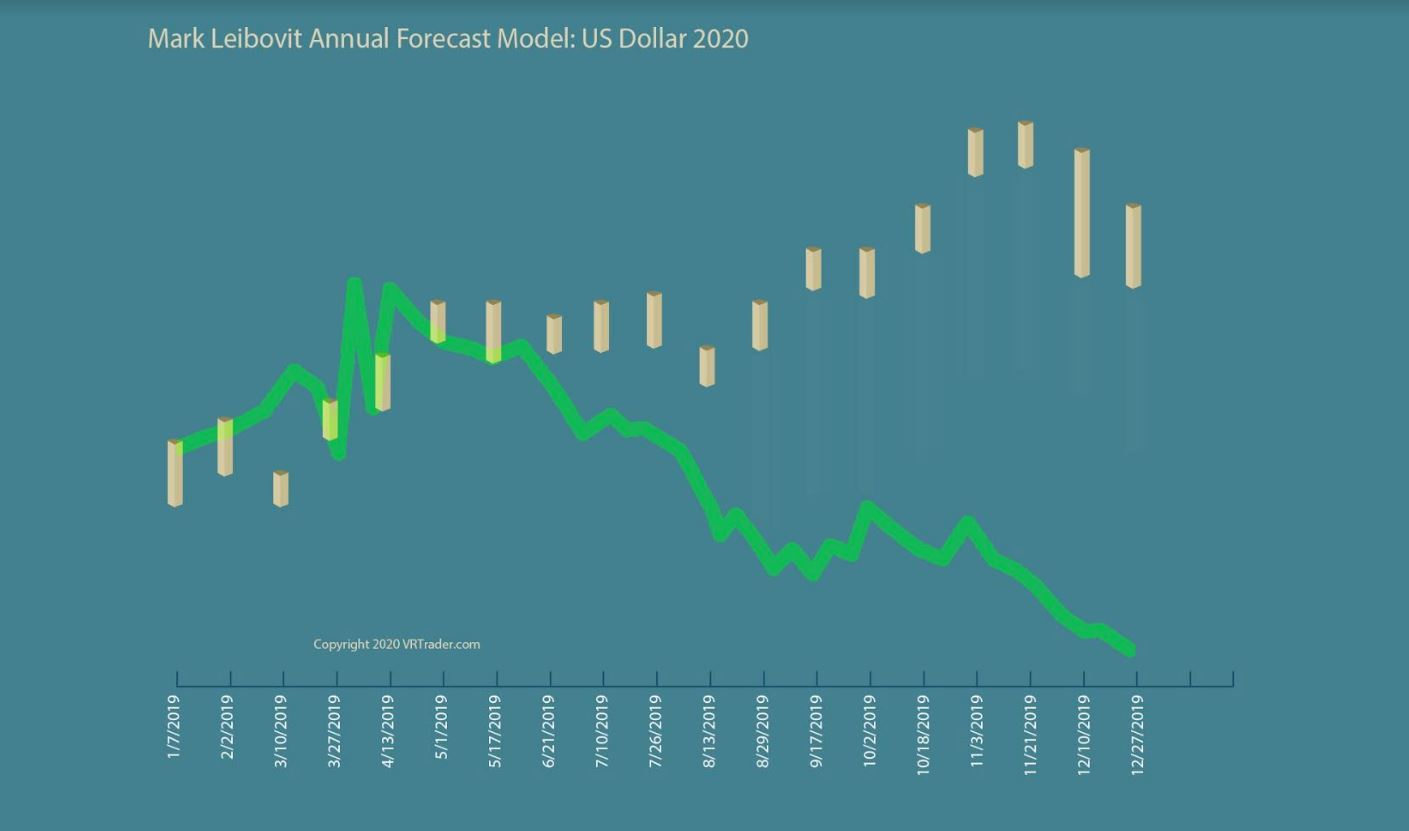
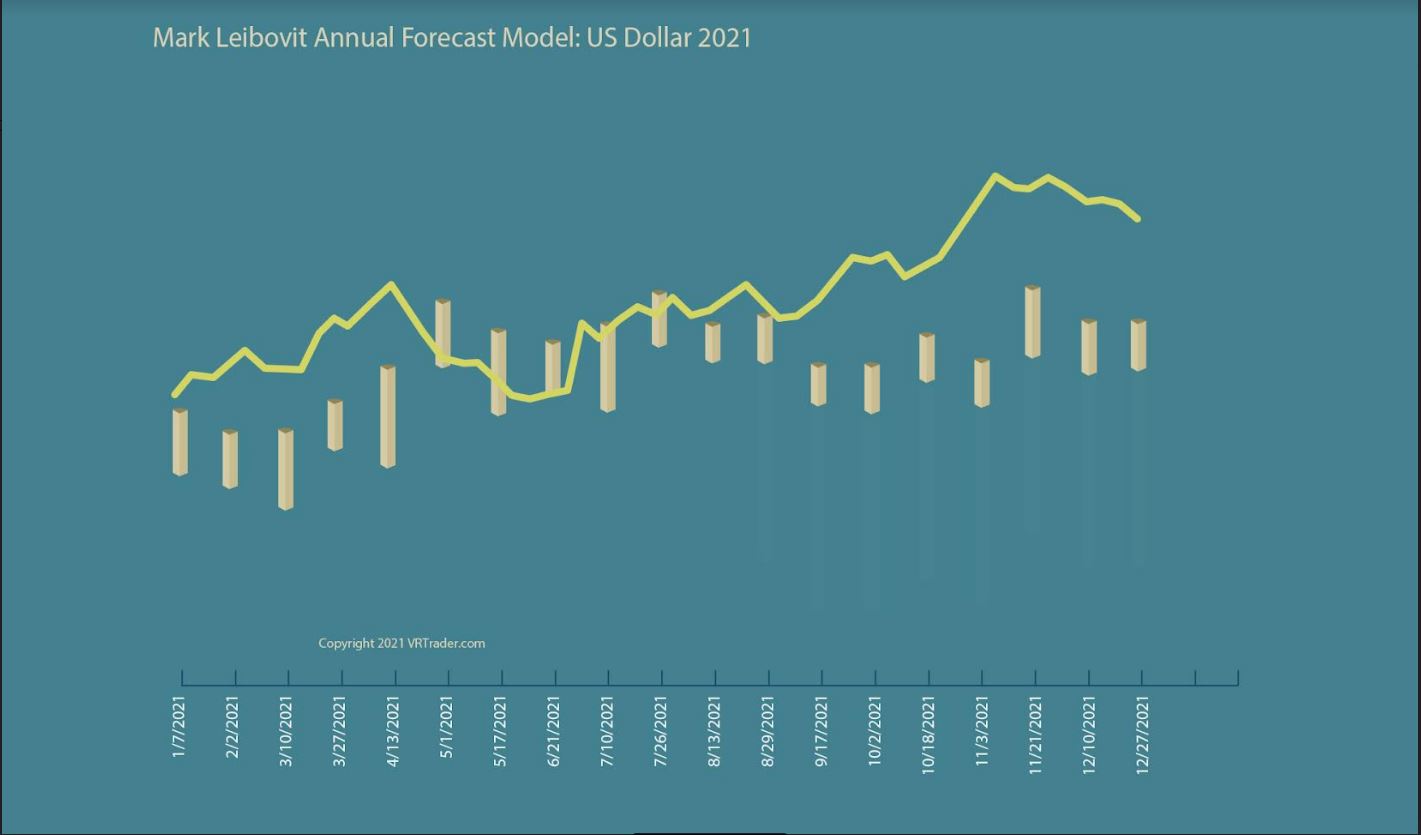
DOLLAR FORECAST 2026
TREASURY BONDS
But first, here are the forecasts and results since 2014:
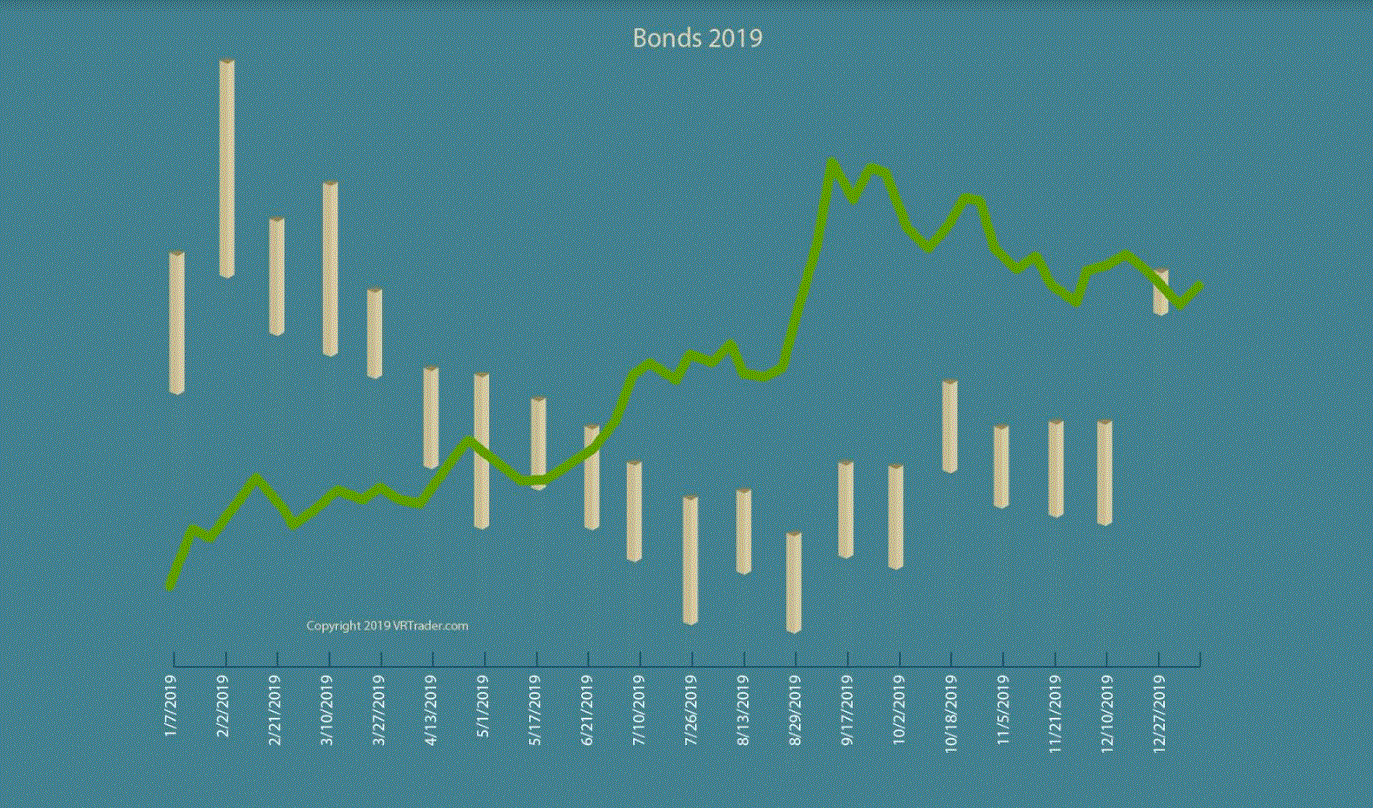
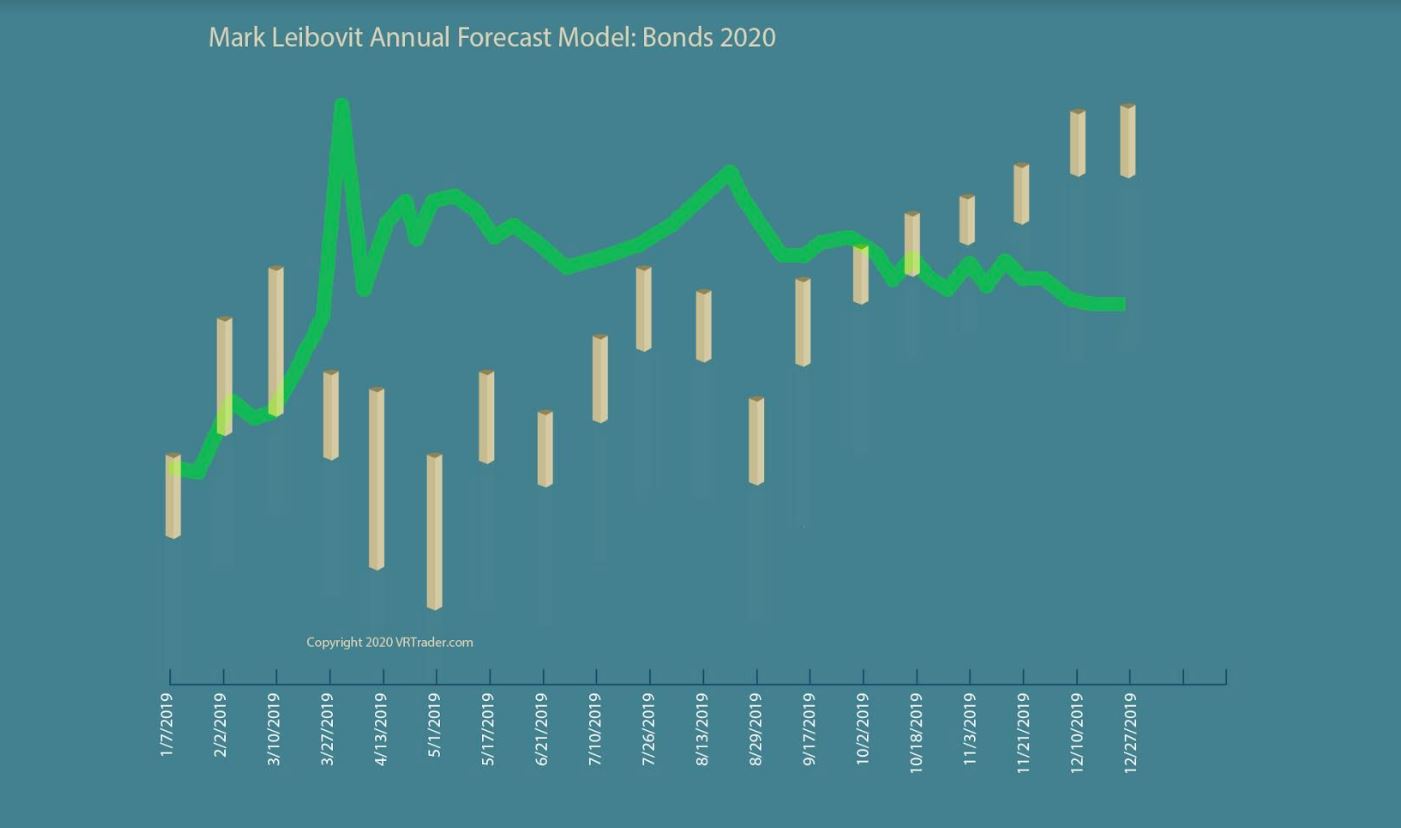
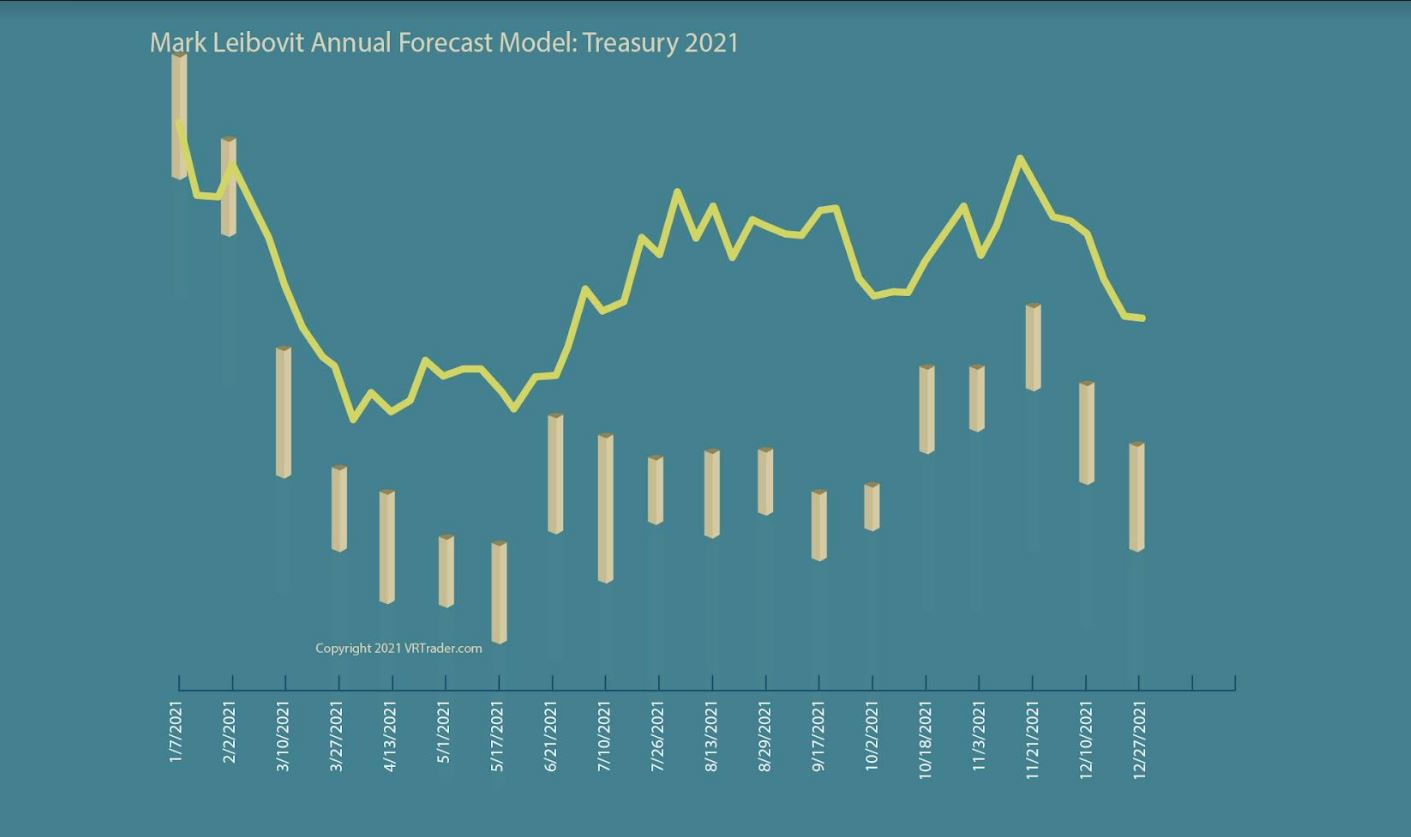
TREASURY BONDS FORECAST 2026
COPPER
THERE WAS NO COPPER FORECAST FOR 2019.
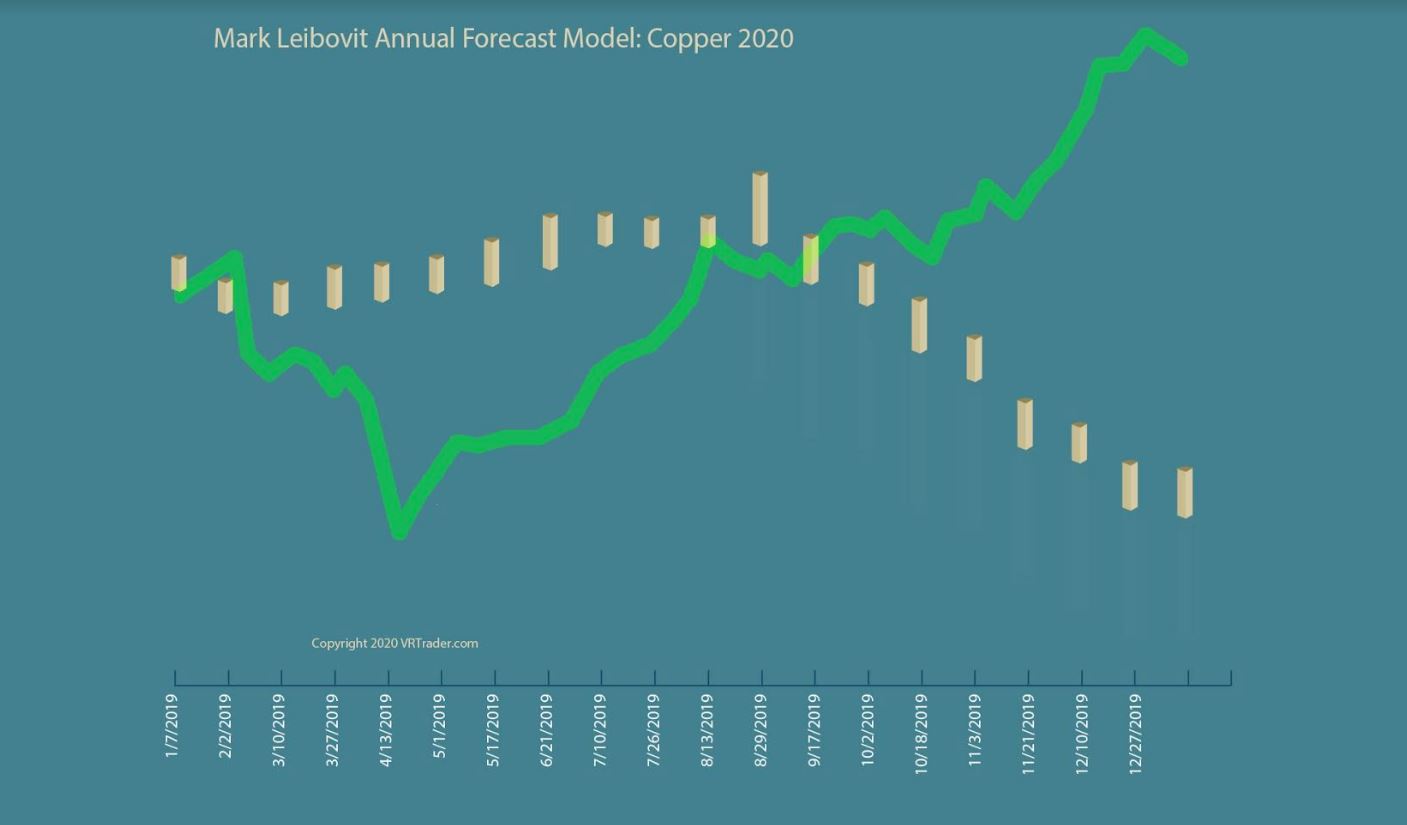
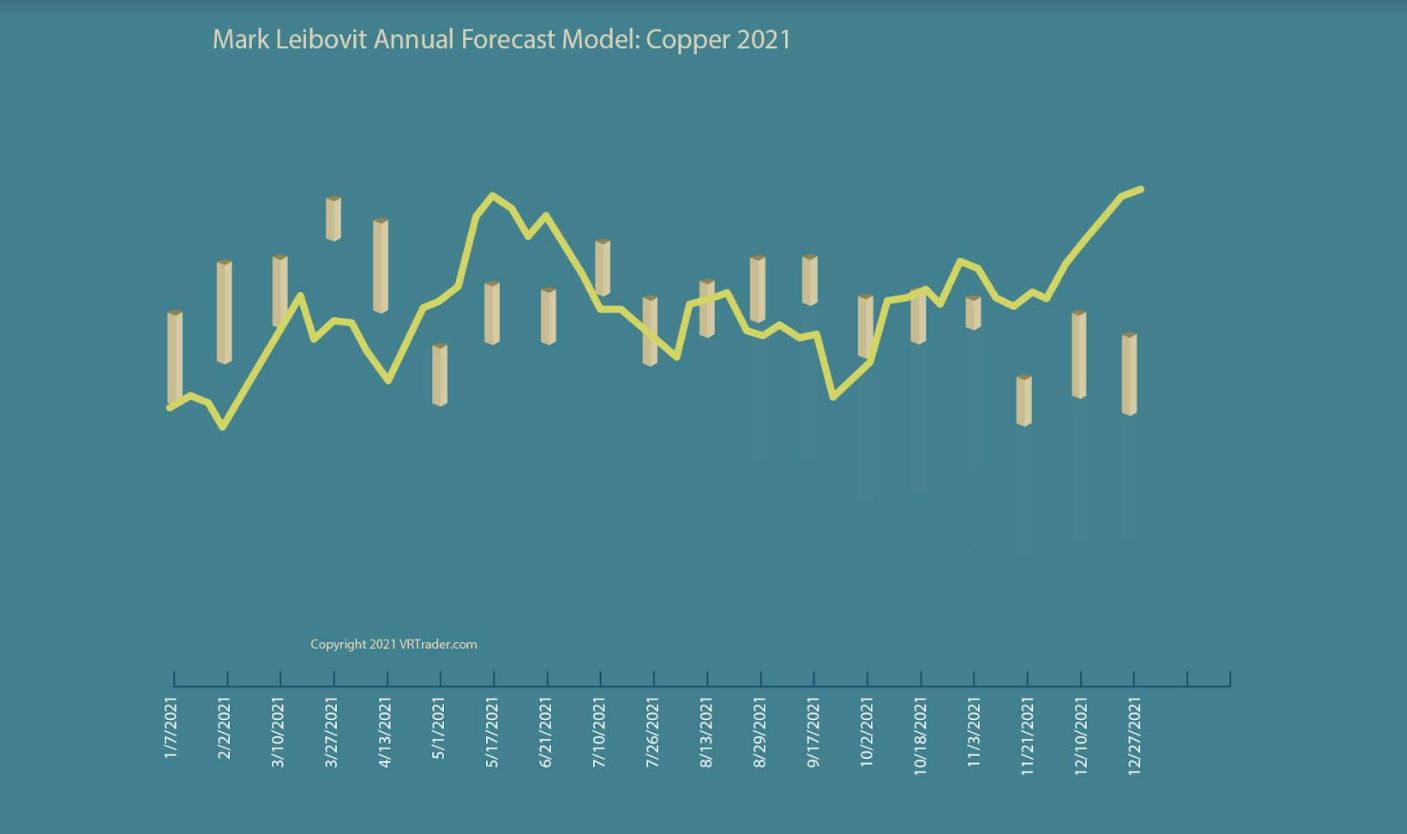
COPPER FORECAST 2026
BITCOIN
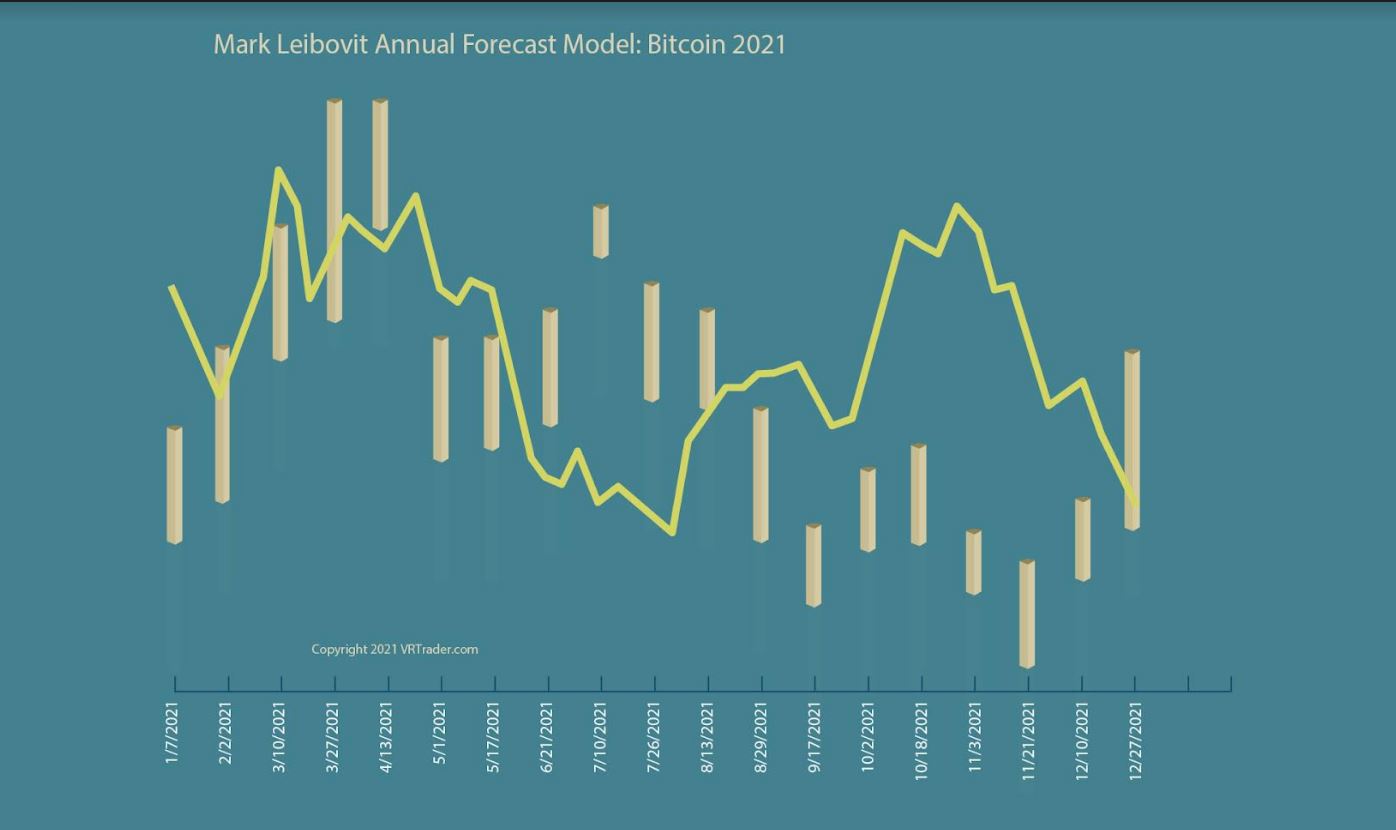
BITCOIN FORECAST 2026
SILVER
THERE IS NO SILVER FORECAST FOR 2020
SILVER FORECAST 2021:
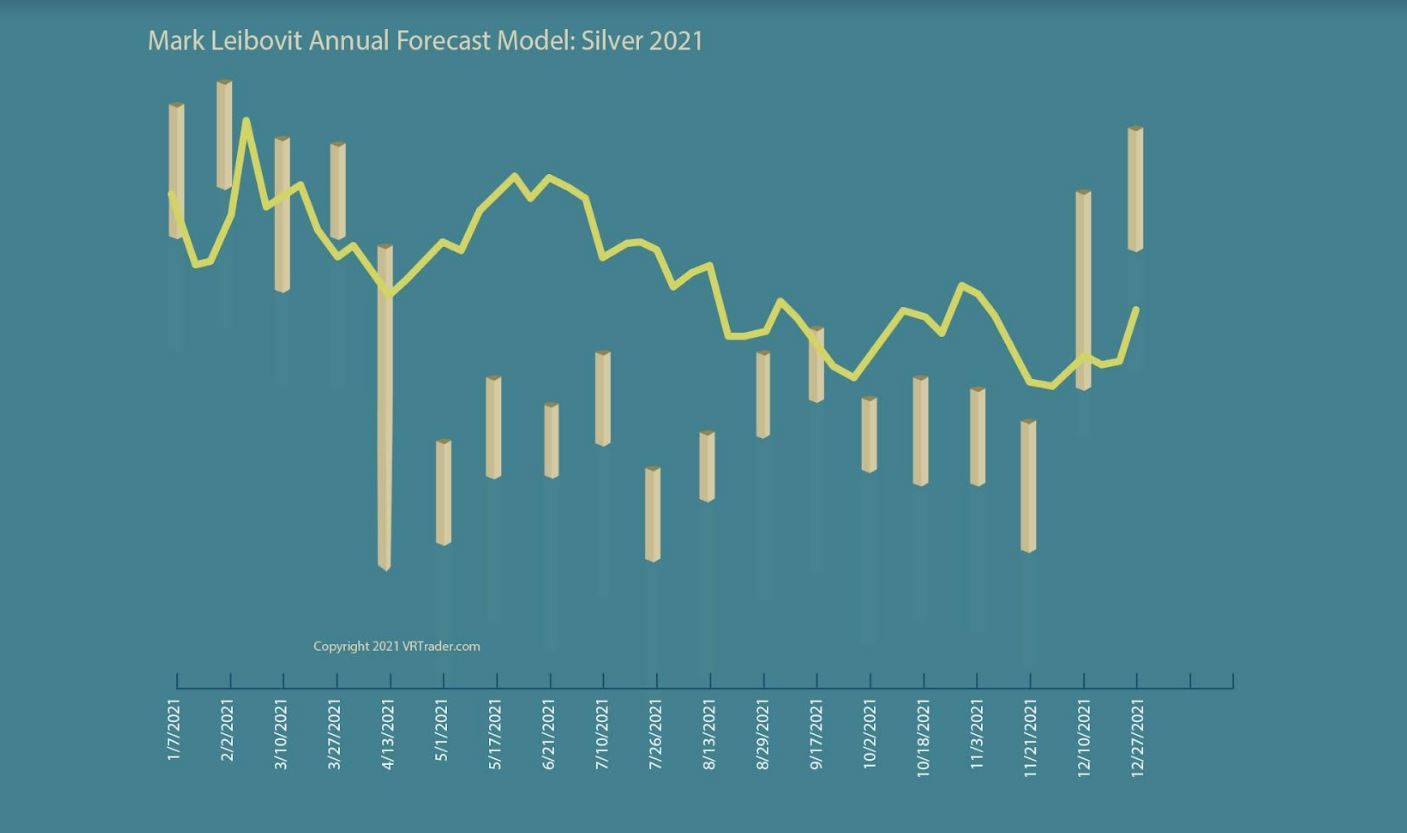
SILVER FORECAST 2026
LITHIUM
LITHIUM FORECAST 2026
URANIUM
URANIUM FORECAST 2026
May I extend my very best wishes to you for a happy, healthy and prosperous year no matter which way the winds blow.
Mark Leibovit, Chief Market Strategist and Editor
February 28, 2026